I cleaned up an Ansible playbook for provisioning a small Ubuntu-based Slurm cluster and put the sanitized version on GitHub.
Repository:
The playbook started as infrastructure code for a local lab environment. Before making it public, I removed site-specific inventories, host variables, generated hardware facts, SSH keys, Munge keys, local environment files, and old reference material. The repository now keeps those files out of Git and includes a Docker Compose environment for validating the roles safely.
Scope#
The repository provisions:
- a Slurm controller,
- CPU and GPU compute nodes,
- Munge authentication,
- SlurmDBD accounting,
- Prometheus,
- Grafana,
- Node Exporter,
- optional DCGM Exporter for GPU telemetry.
The useful part is that the same Ansible structure can be tested locally before touching real machines.
Docker validation#
The local test environment can be started with:
task dev:up
task dev:deploy
task status ENV=docker
The Docker inventory creates one controller and three compute containers:
| Node | Role |
|---|---|
controller | Slurm controller, SlurmDBD, Prometheus, Grafana |
gpu1 | example GPU compute node |
gpu2 | example GPU compute node |
cpu1 | example CPU compute node |
The Docker-only SSH and Munge keys are generated under secrets/, which is ignored by Git.
Slurm resource view#
I also restored a small reference command named sres, which prints a compact view of Slurm node resources. In the Docker cluster, it produced:
┌───────────┬────┬─────────┬──────────────┬──────────────────────┐
│      node │ ST │   CPU   │    memory    │       CPU-JOBS       │
├───────────┼────┼─────────┼──────────────┼──────────────────────┤
│      cpu1 │ 🐟 │  6 / 6  │  23 / 23  GB │       CPU free       │
├───────────┼────┼─────────┼──────────────┼──────────────────────┤
│      gpu1 │ 🐟 │  6 / 6  │  23 / 23  GB │       CPU free       │
├───────────┼────┼─────────┼──────────────┼──────────────────────┤
│      gpu2 │ 🐟 │  6 / 6  │  23 / 23  GB │       CPU free       │
└───────────┴────┴─────────┴──────────────┴──────────────────────┘Monitoring#
Prometheus is configured to scrape the controller and compute nodes.
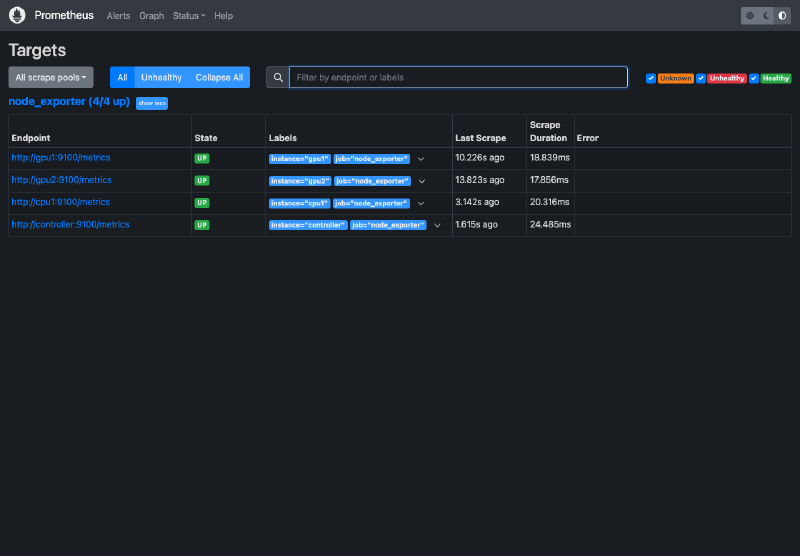
Grafana is provisioned with dashboards for the Slurm cluster and node metrics.
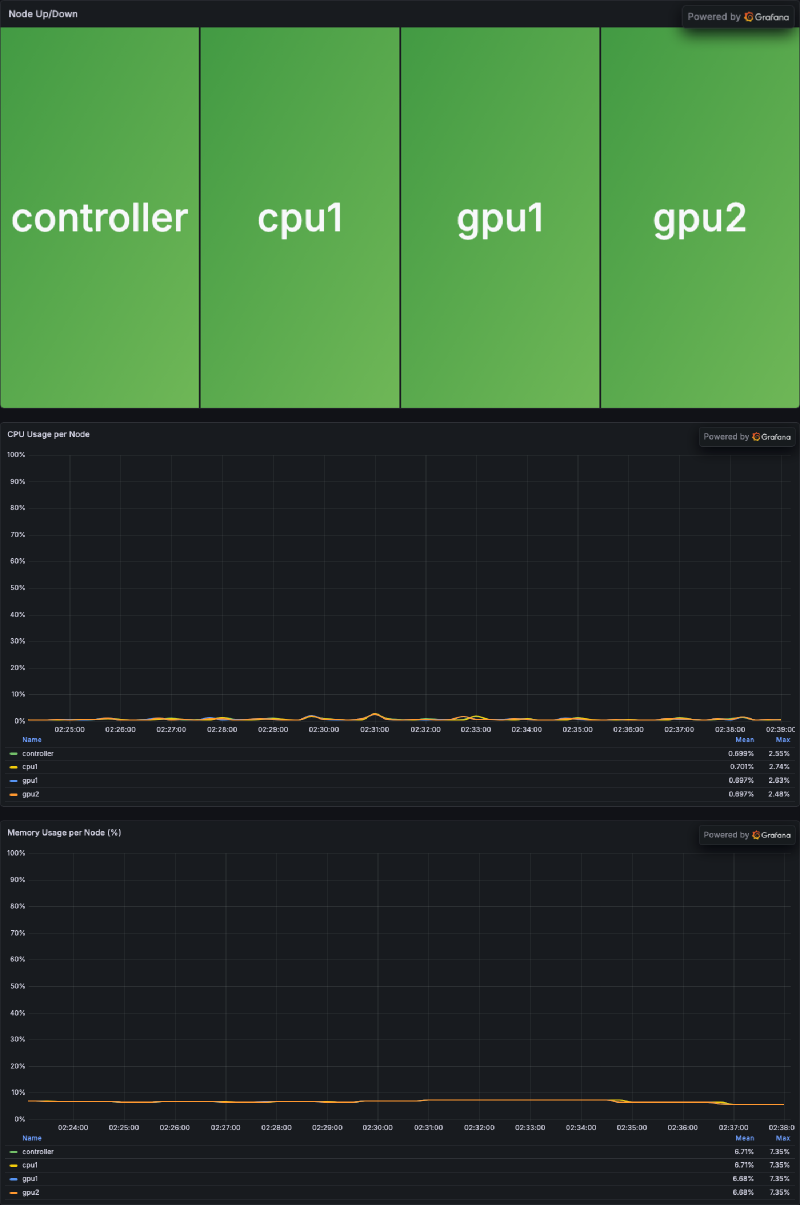
Keeping the Grafana provisioning files and dashboard JSON in Git makes the monitoring layer easier to reproduce after rebuilding the environment.
Cleanup checklist#
The highest-risk part of sharing an Ansible repository is usually not the playbook itself, but the surrounding local state. I checked for:
- SSH private keys,
- copied public keys from real hosts,
known_hosts,- Munge keys,
- real host variables and IP addresses,
.envfiles,- internal URLs embedded in dashboards,
- old reference files.
The repository also has a security and publishing checklist.
References#
- Repository: shota-ke/slurm_ansible
- Ansible documentation
- Ansible playbooks
- Ansible roles
- Slurm Quick Start Administrator Guide
- Slurm accounting and resource limits
- Slurm GRES scheduling
- Docker Compose documentation
- Taskfile documentation
- Prometheus getting started
- Prometheus Node Exporter guide
- Grafana provisioning documentation
- NVIDIA DCGM Exporter documentation